


Time to first byte (TTFB) shows how long Magento 2 (M2) takes to generate page HTML. This is the main metric of website performance. TTFB directly affects search rank position.
A lot of complaints are being made about slow M2. If you struggle with poor performance, a TTFB optimization audit is the first thing to tackle.
I will walk you through the various steps of a server response time analysis. I will also show you what tools to use and how to analyze a profiler trace, but first a little bit of theory.
What is a Server Response Time (TTFB) Audit?
TTFB, or server response time, depends on how much code the PHP interpreter has to run. Complex e-commerce platforms like Magento have millions of lines of code. It is easy to get lost in them. A TTFB audit helps you understand what code is actually run and how much time it takes to run it.
Now what tools do we need to perform a Magento 2 TTFB audit? I personally use these three: Magento's default profiler, Mirasvit's profiler extension, and XHProf.
Default Magento 2 Profiler
Magento 2 has a built-in profiler that helps analyze server response time. It outputs a trace with code blocks and time breakdowns.
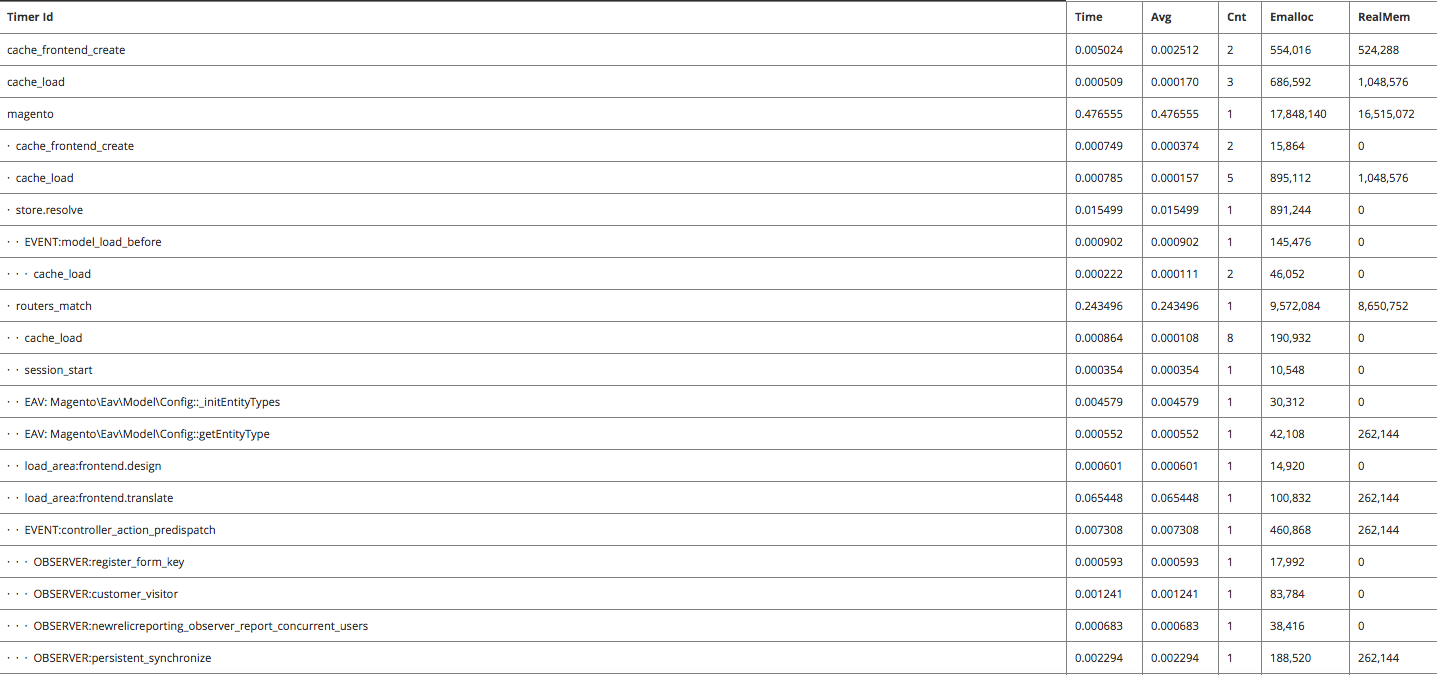 Magento 2 Profiler Trace
Let me explain the columns:
- Timer id - a unique identifier that is used in profiler start function call:
MagentoFrameworkProfiler::start('Timer id', $profilerTags).
- Time - time in seconds that has passed between MagentoFrameworkProfiler::start and MagentoFrameworkProfiler::stop calls with the same Timer id. To get an idea of what code is run, search codebase for 'Profiler::start.*timer_id'. You can use the following terminal find command: find vendor -type f -exec grep -iHn --color=always 'Profiler::start.*timer_id' {} ; In place of timer_id put the identifier you are interested in.
- Cnt - how many times the specified code block was run.
- Avg - Time / Cnt, or the average time spent running the code block one time.
- Emalloc - memory used in bytes consumed by PHP to run the specified code block. The output of the memory_get_usage() function call.
- RealMem - all memory allocated by the system for PHP processes, including unused pages. The output of the memory_get_usage(true) function call.
Optimize TTFB with The Default Profiler
To enable the default profiler, open up the index.php file which resides in the Magento root folder. After opening, put the following line at the top of the index.php file right after <?php:
$_SERVER['MAGE_PROFILER'] = 'html';
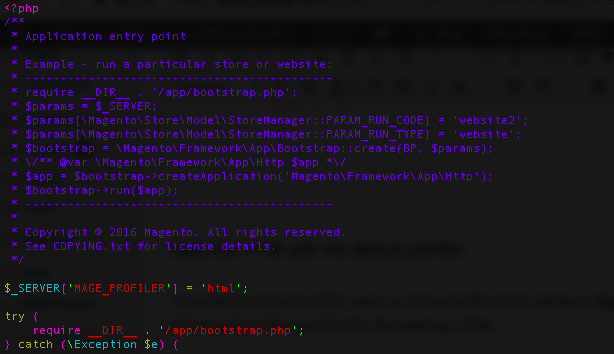 Enable Magento 2 Profiler
Magento will output a trace at the bottom of a front-end page. Change html to csvfile and you will find the profiler output in var/log/profiler.csv.
When working with the default profiler, the columns you should pay attention to are Time and Cnt. Start to identify Timer ids with the most Time or Cnt, then search Magento files to find where those particular code blocks are. Analyze them to see if you spot any unoptimized patterns.
There is one important thing you must keep in mind - profile entries are nested. This means one entry's time includes all of its children's times. If you see a Timer id with a high Time column value, then you need to figure out whether or not it is because of its children.
Let's take a real life example. Here is a trace from a client's Magento 2 site. Full Page Cache is off.
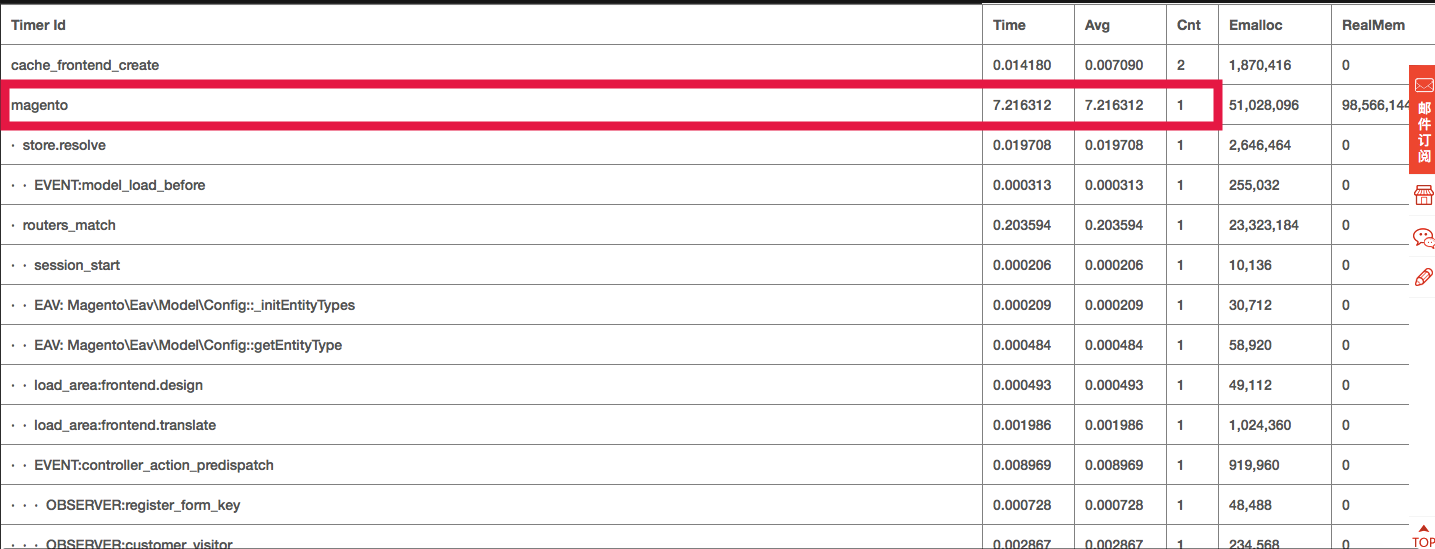 Magento 2 Live Site Trace
We see that Timer ID=magento takes over 7s. Do we need to inspect magento? No. We need to go deeper and inspect magento's children. Dots on the left show us a Timer id's nested level.
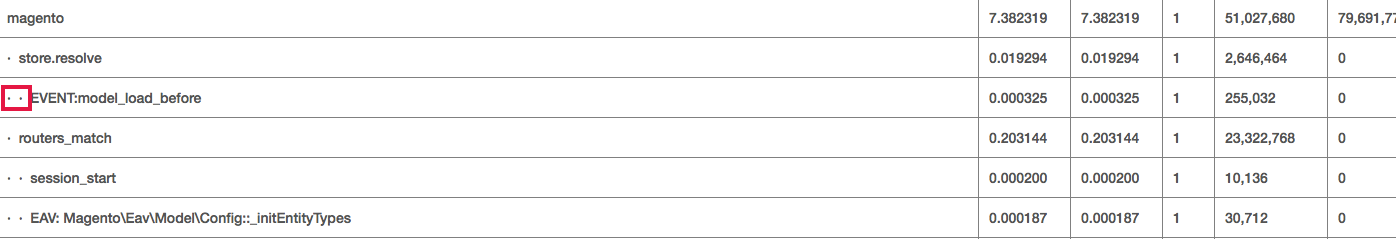 Dots Show Nested Level
Ok, now let's scroll down and look at magento's children.
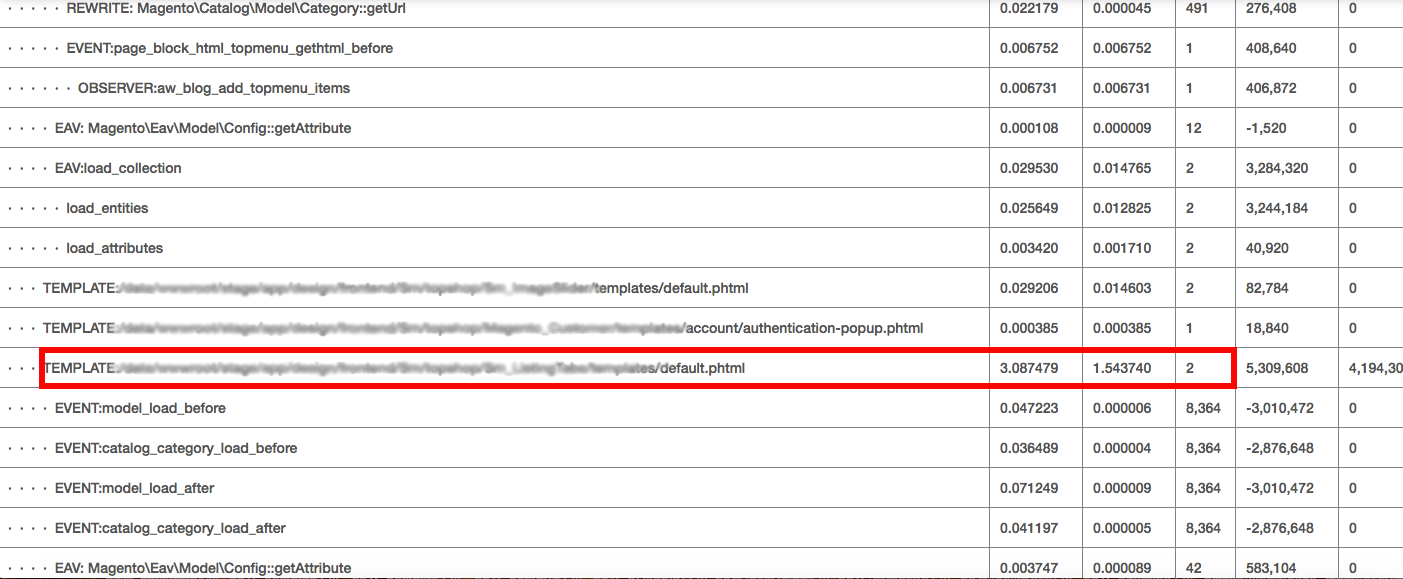 Inspect Magento Timer Children
Here we find that the default.phtml template takes over 3 sec to run. Notice that it has been run 2 times. Does it need to be run 2 times or is this a sign of unoptimized code? You need to investigate this. In a nutshell that is what the TTFB audit process is all about. You go from timer to timer and inspect underlying code.
Mirasvit Profiler Extension
The next tool to try is the Magento 2 profiler from Mirasvit. It is freely available on GitHub.
Installation is easy. Simply run the following SSH terminal commands inside the root folder:
composer require mirasvit/module-profiler

php -f bin/magento module:enable Mirasvit_Profiler
php -f bin/magento setup:upgrade
To enable the profiler, run the following command:
php -f bin/magento mirasvit:profiler:enable
Now, reload a front page and at the bottom you will see the profiler bar. (In the example below I use the same client site we used in the previous example.)
We see that the page took 15.2 sec to load and all SQL queries took 1 sec. Now let's click the View link on the right. This takes us to the performance overview.
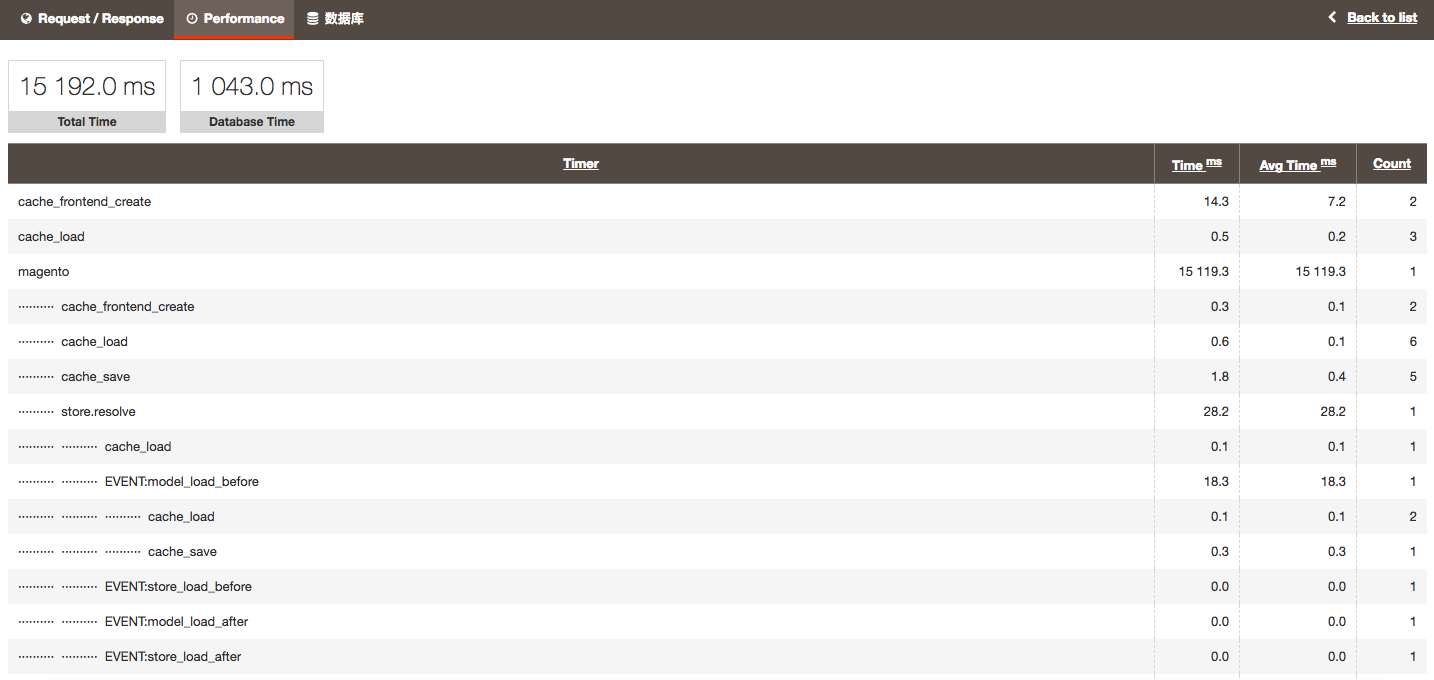 Profiler Performance Overview
The table columns are similar to those of the default profiler but now you can sort them. For example, to see timers with the most time you just click on the Time column then wait a bit and see the sorted list.
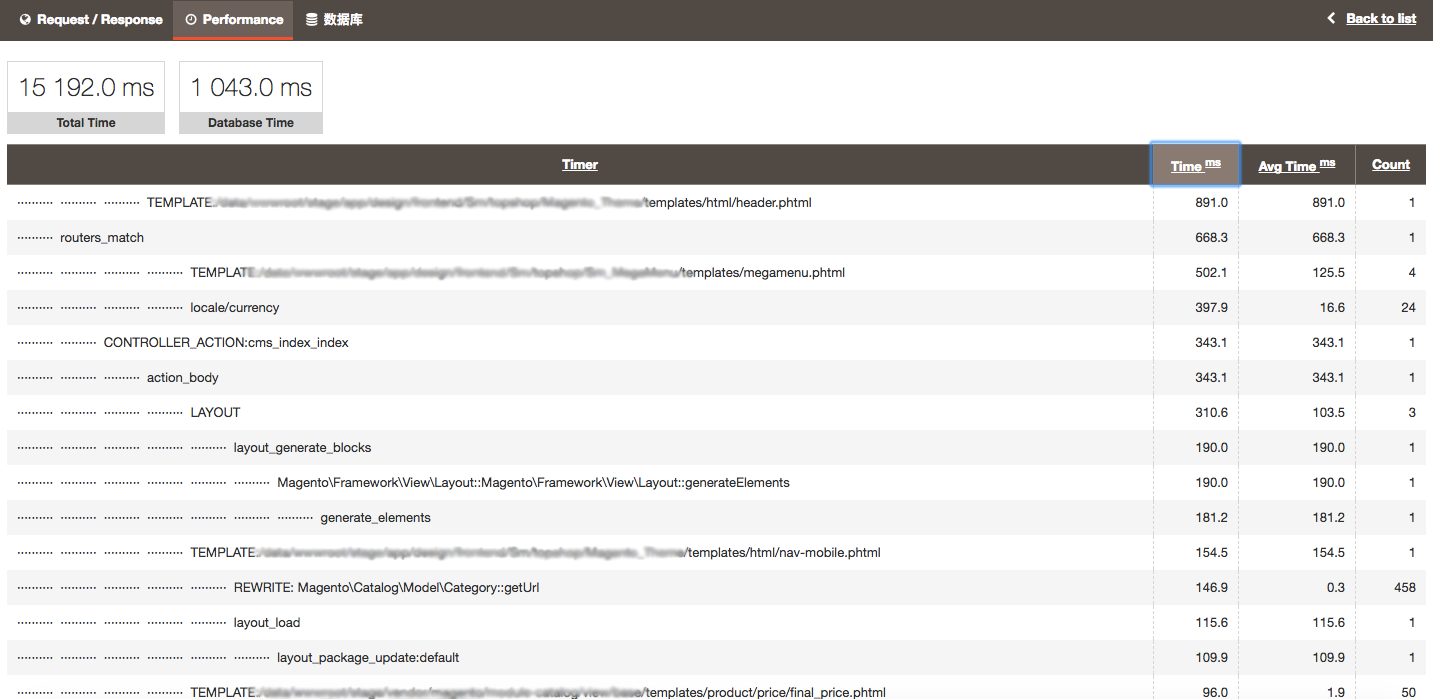 Sorted Time Column
There is a little bug though: it doesn't put the magento timer with 15s at the top.
By looking at the sorted column I see the first possible sign of poor code. See how the locale/currency code block was executed 24 times? Was that necessary? You need to find out by inspecting its parent timer, which might be megamenu.phtml.
Reduce Magento 2 Server Response Time with XHProf
This little program I like the most. You get the most detailed view of Magento 2 performance using XHProf.
XHProf works with PHP5 and PHP7. Below you can see how to set it up with PHP5.
1. Install XHProf
The installation process is simple. I will assume you are using Debian OS with Apache2 and PHP5.
Install pear:
sudo apt-get install pear
Then php5-dev:
sudo apt-get install php5-dev
Follow up with xhprof:
sudo pecl install -f xhprof
Open up /etc/php5/apache2/php.ini (path to php.ini might vary on your server) and add the following lines:
extension=xhprof.so
xhprof.output_dir="/var/tmp/xhprof"
Restart apache2:
sudo service apache2 restart
2. Setup Magento 2 with XHProf
First download a package from https://pecl.php.net/package/xhprof and copy it to MAGENTO_ROOT_FOLDER/xhprof .
Next create two files: MAGENTO_ROOT_FOLDER/header.php
<?php
if (extension_loaded('xhprof')) {
    include_once 'MAGENTO_ROOT_FOLDER/xhprof/xhprof_lib/utils/xhprof_lib.php';
    include_once 'MAGENTO_ROOT_FOLDER/xhprof/xhprof_lib/utils/xhprof_runs.php';
    xhprof_enable(XHPROF_FLAGS_CPU + XHPROF_FLAGS_MEMORY);
}
And MAGENTO_ROOT_FOLDER/footer.php
if (extension_loaded('xhprof')) {
    $profiler_namespace = 'MAGENTO2';
    $xhprof_data = xhprof_disable();
    $xhprof_runs = new XHProfRuns_Default();
    $run_id = $xhprof_runs->save_run($xhprof_data, $profiler_namespace);

    $profiler_url = sprintf('http://magento2.domain/xhprof/xhprof_html/index.php?run=%s&source=%s', $run_id, $profiler_namespace);
    echo '<a href="'. $profiler_url .'" target="_blank">Profiler output</a>';
}
Finally, edit the .htaccess file to automatically prepend/append the header/footer to your Magento 2 page:
php_value auto_prepend_file MAGENTO_ROOT_FOLDER/xhprof/header.php
php_value auto_append_file MAGENTO_ROOT_FOLDER/xhprof/footer.php
Now reload any front page and you will see a link to XHProf trace at the bottom.
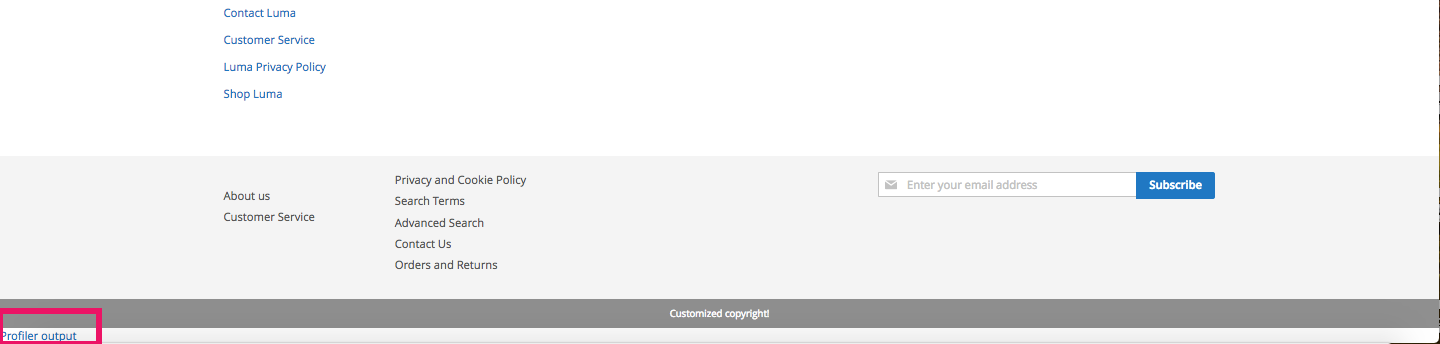 XHPROF Link on Magento Site
Click on it and it will take you to the profiler output:
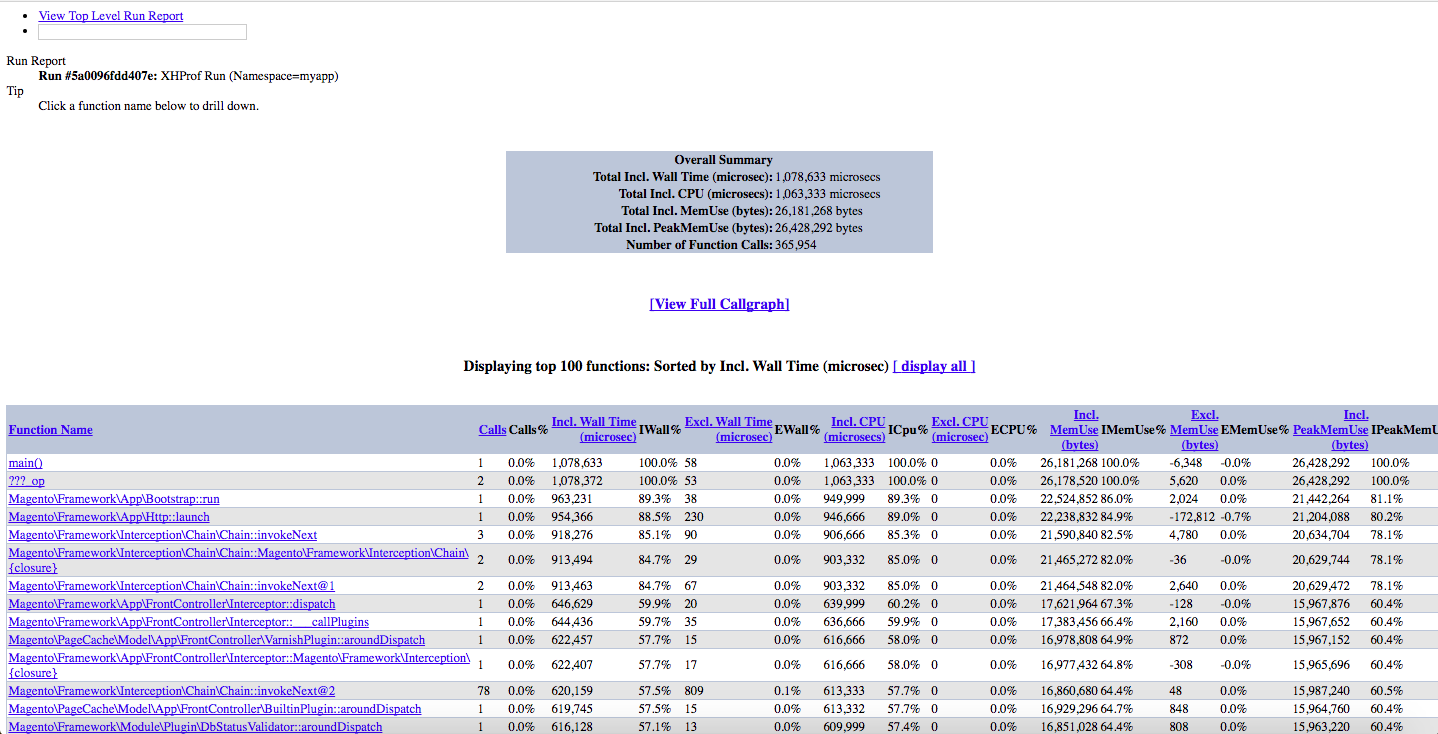 XHPROF Output
From here you can inspect any individual function and get an overview of its children and parents. For example, if we click on MagentoFrameworkAppHttp::launch we get the following:
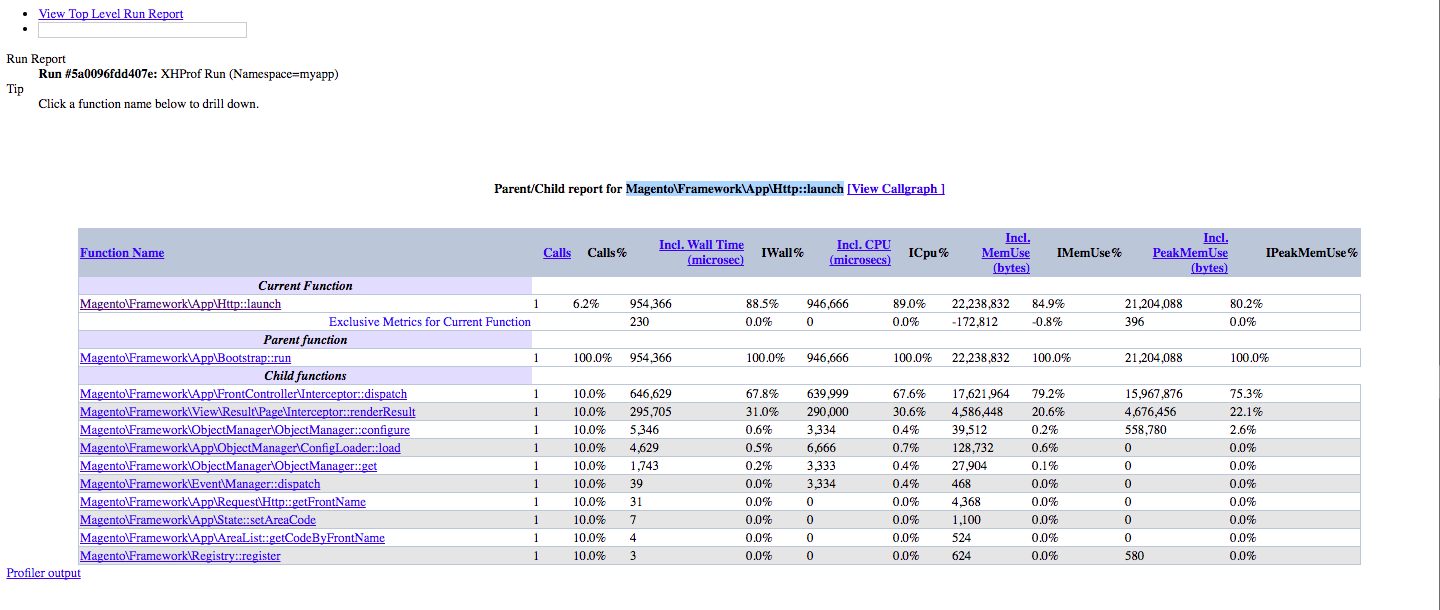 XHPROF Individual Function Overview
3. An Example of Profiling Magento 2 with XHProf
Now I will show you how you can use XHProf to identify and fix performance hogs in Magento 2.
Suppose your category pages are slow. Fire up XHProf and go to any category page.
 Magento 2 Category Page
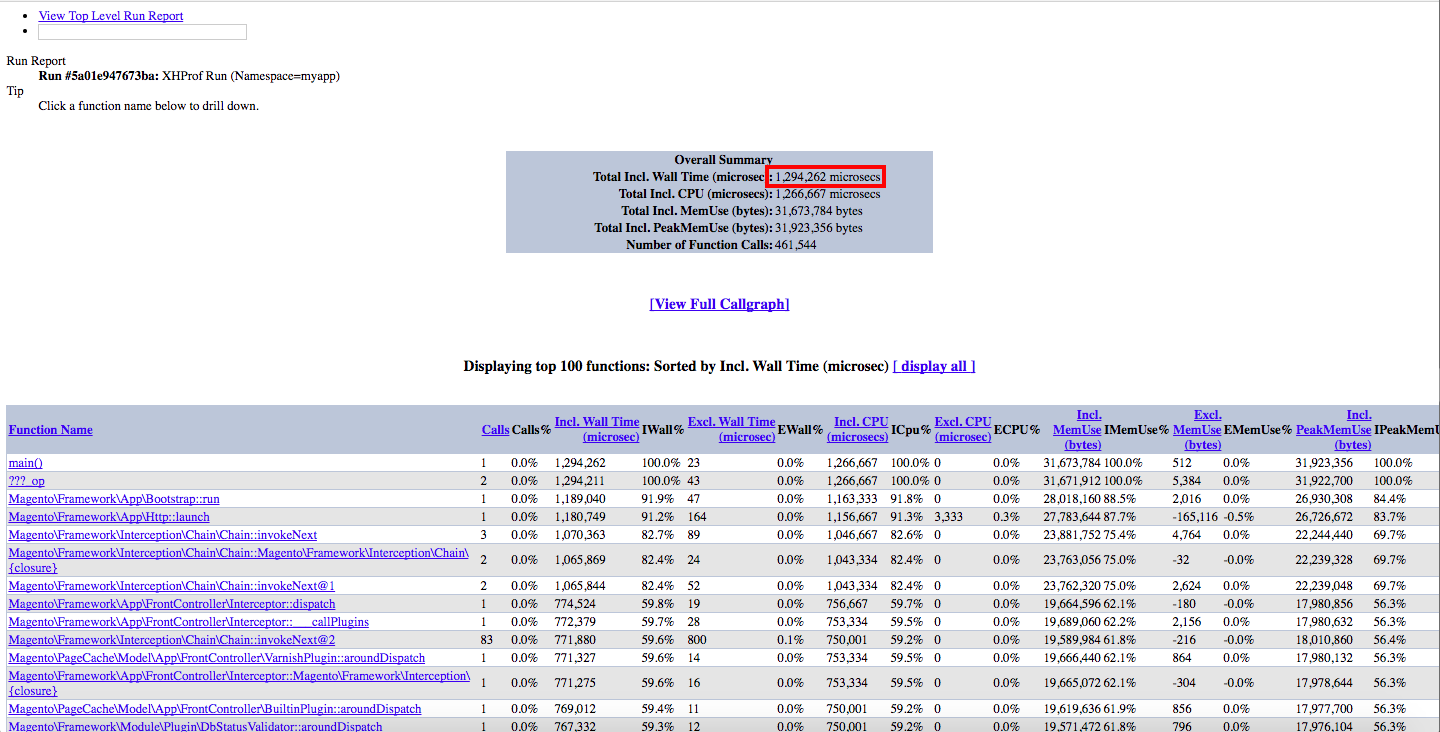
Click on Profiler Output at the bottom left and open the performance summary.
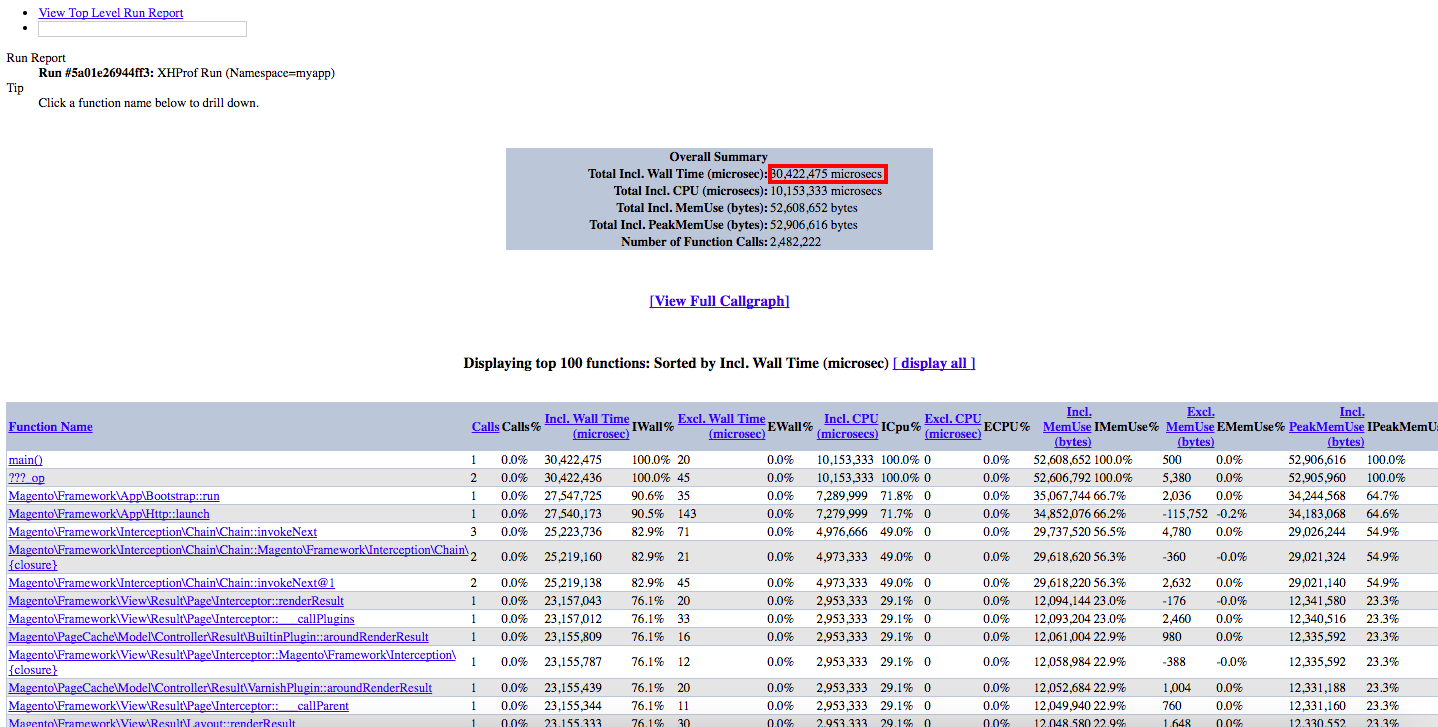 Category Page XHPROF Performance Summary
We see the page load time is 30 sec! Something is definitely going on.
Now, to find out an abusive function call, let's sort by Excl. Wall Time. Excl. Wall Time is how long a specific function call took to be executed without considering any child functions.
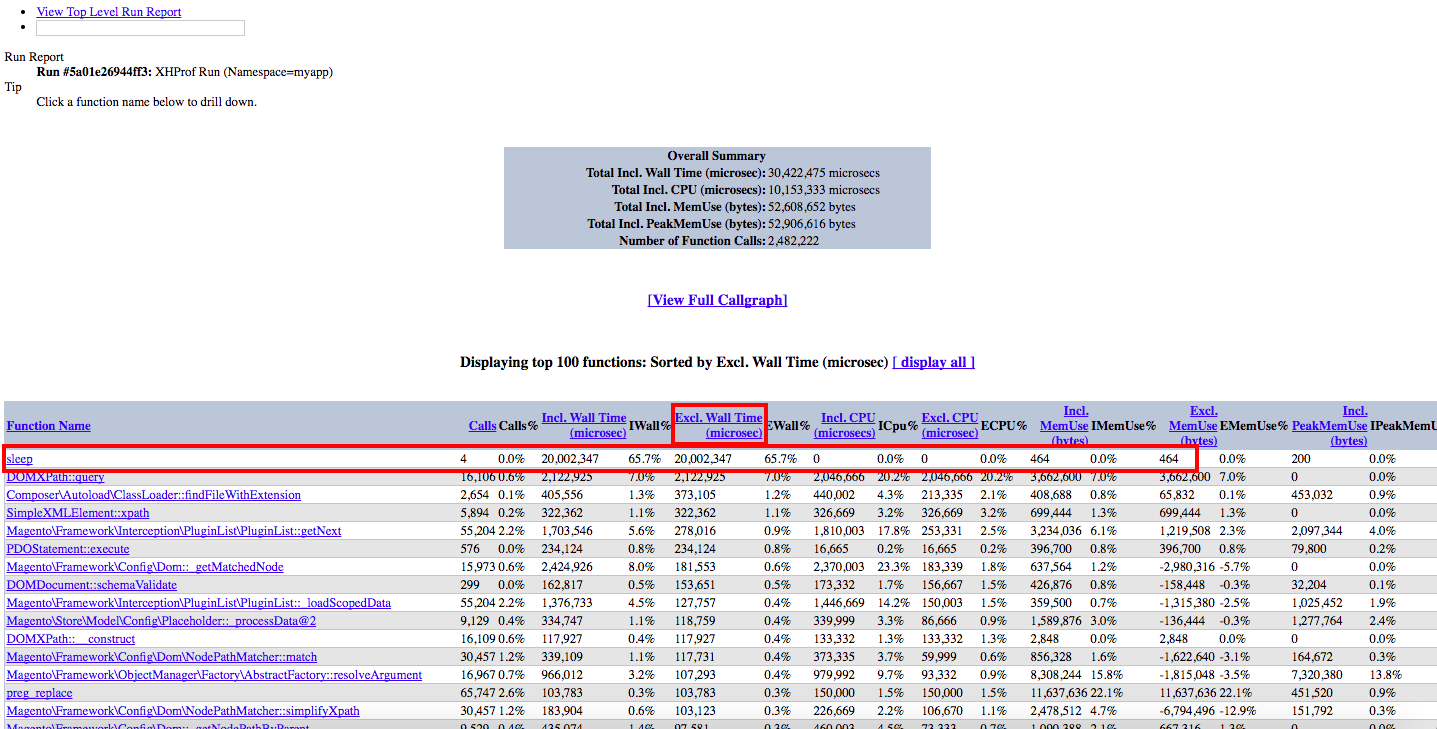 XHPROF Performance Summary Sorted By Excl. Wall Time
We see that there is a sleep function somewhere in the code that took 20 sec! When we click on sleep it shows the parent function:
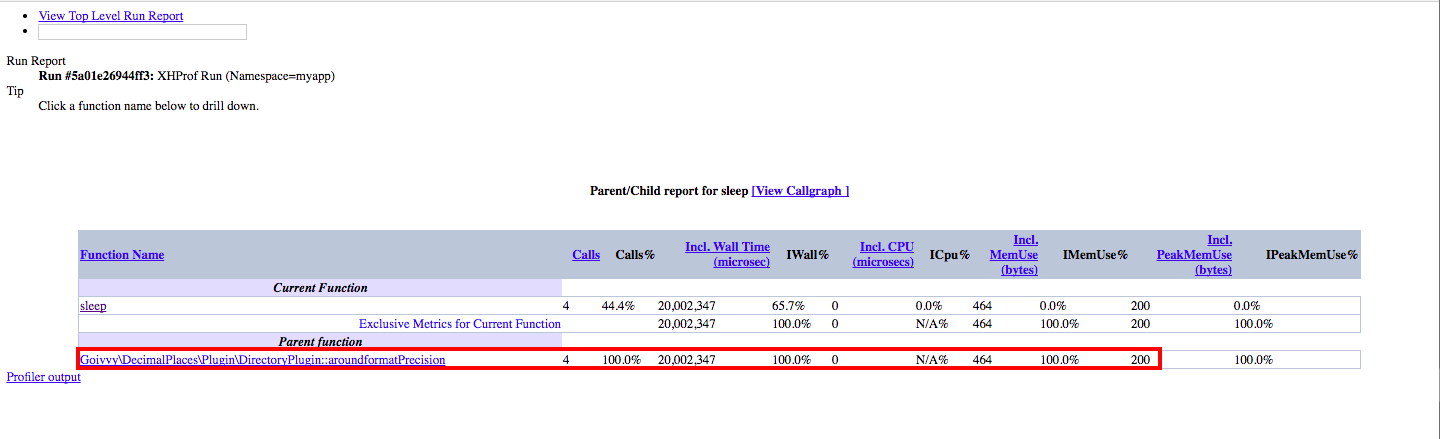 Sleep Parent Function
Now if we open up the app/code/Goivvy/DecimalPlaces/Plugin/DirectoryPlugin.php file, we see the sleep function there:
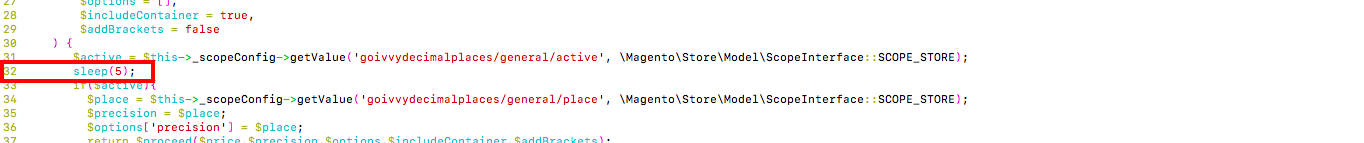 Plugin File with Sleep Function
I am not sure how it got there but it needs to be removed. Once we delete sleep we are able to reload a category page and see that it is much faster:
 Optimized Category Page
Summary
TTFB optimization is the only right way to fix a slow Magento 2 site. Caching, faster hardware, etc. will just hide the problem. When profiling server response time you actually identify the cause of poor performance.
If you happen to run Magento 1 I wrote a tutorial on how to optimize TTFB for M1.
Find this article useful? Share it on LinkedIn with your professional network, spread the knowledge!
If you find this post interesting do not hesitate to sign up for our newsletter and join the 1010 people who receive Magento news, tips and tricks regularly.
Thank You!
Sorry but doenst work in magento 2.4.1, and i dont understand this:
Next create two files: MAGENTO_ROOT_FOLDER/header.php
And MAGENTO_ROOT_FOLDER/footer.php
and later:
php_value auto_prepend_file MAGENTO_ROOT_FOLDER/xhprof/header.php
php_value auto_append_file MAGENTO_ROOT_FOLDER/xhprof/footer.php
the routes are not the same...
Dont work for me but thanks anyway
Just Brilliant. 10/10
You helped me to save up to 2 seconds!!
thanks again
thanks for such an informative article i totally loved keep posting such article o this blog
That's some informative article. Thanks.
Thank you for the article, Bookmarked the page.
Thank for this , experiencing blog.
@Ramit, yes it will.
Is this work for magento 2.3.0?
[...] Magento 2 TTFB Optimization – https://www.goivvy.com/blog/magento-2-ttfb-optimization [...]
@Laxman Yes it does.
Thanks for great information on TTFB.
Is this work for magento 2.3.0?
Alan,
thank you for your inquiry.
I am going to follow up with you via email but for my audience I will just say that you might have a problem with one of your custom extensions.
Hi,
We have a ecommerce store running magento 2.5. It has just recently been launch after a migration from mage 1. We have varnish enabled and most of the common settings adjusted (I think), but we are still experiencing loadtime in the 5 second range or so. This is a small site (150 products or so).
Can you provide some guidance estimates to address performance issues? We are using MageMojo for our hosting (non-cloud service).
Thanks,
Alan
Thank you for the article. Defiantly I learn a lot of thinks how to improve my page performance. In addition to the above mentioned tips, I'd suggest to also set up a monitoring system on your server such as Monitis. They have Magneto synthetic transaction monitoring. http://www.monitis.com/product